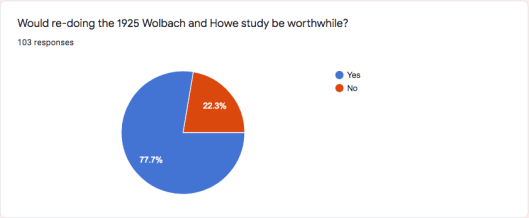
The following charts summarize the results from our recent 2020 survey. The questions that asked for free form text input or that asked for comments are not yet included here.
I’ll post the survey’s raw data (sans email addresses) by Nov 26. Please let me know before then if you don’t want me to include your individual response in that data set.
Josh G has provided statistical analysis of the response data. It is available here:
Thanks Josh,
I’ve also put up a video sharing my thoughts on the survey results.


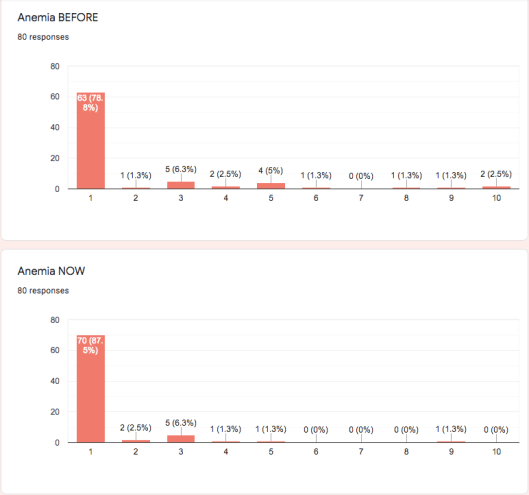
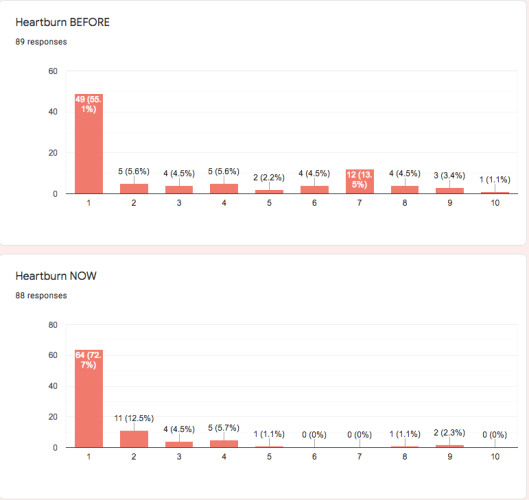
For the following questions the instructions were:
For each of the following conditions, please state on a scale of 1 to 10 how severe this condition was BEFORE starting the diet, where 1 is “a minor annoyance,” 5 is “interferes with normal functioning”, and 10 is “severely debilitating.” Then mark how severe this condition is NOW using the same scale.
Therefore, seeing the bars in the charts shift over to the left hand side indicates that the condition is improving or becoming less severe.
Psychological / Brain Issues


Skin Related Issues


Bone/Joint issues


Gastro-intestinal issues


Vision and hearing issues:


Blood Issues:


Miscellaneous:


Pingback: ویتامین A، کلید اصلی سلامتی؟ - مجله خبری مد و استایل - مد و استایل